Warming Scenarios for Washington State
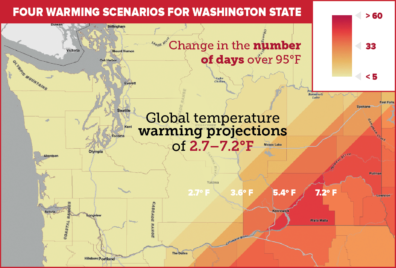
The Pacific Northwest is hotter than it used to be, and the growth in hot days will continue. Global temperatures are projected to warm by 3.6°F (2°C) over pre-industrial levels by the 2040s to the 2060s, according to recent research. That means more days over 95°F in Washington.
Click on the map below to see how Washington counties will be affected by more days of extreme heat in that projection.

Learn more about how global warming will affect Washington’s climate through the National Climate Assessment Interactive Atlas Explorer. The atlas illustrates changes in climate patterns, including heat and precipitation, under four scenarios between 2.7–7.2°F (1.5–4˚C).
Sources
Climate Change 2013: The Physical Science Basis, Cambridge University Press
Diffenbaugh, Noah S. & Barnes, Elizabeth A. (edited by Michael Mann). “Data-driven predictions of the time remaining until critical global warming thresholds are reached.” Proceedings of the National Academy of Sciences, vol. 120, no. 6, Feb. 2023
National Climate Assessment Interactive Atlas Explorer-U.S. Global Change Research Program, NOAA, CICS-NC, ESRI
Tollefson, Jeff. “Diagnosing Earth: the science behind the IPCC’s upcoming climate report.” Nature, Aug. 5, 2021