Between the book Moneyball and the movie “Moneyball,” there was the 2010 Simpsons episode “MoneyBART,” which introduced 6 million or so people to the artist Banksy, who wrote the opening sequence. Less celebrated is the fact that the show introduced many people to the concept of sabermetrics.
A viewer’s guide to the episode can go a long way in explaining some of the fundamental notions of baseball’s most exuberantly rational side.
First, the quick plot summary:
Lisa Simpson needs an extracurricular activity to pad her application to Yale, so she signs on to coach Bart’s Little League team, the Isotots. She drops by Moe’s Tavern to ask the patrons to teach her about the game. There she comes across four men, including Professor John Nerdelbaum Frink Jr., as they crunch numbers about different players.
“Baseball is a game played by the dexterous but only understood by the Poindextrous,” asserts Dr. Frink. Which is to say, a lot of muscle and skill goes into playing the game, but underlying the on-field theatrics is a complicated web of objective statistics and probabilities best grasped by the likes of—you can see where this is headed—nerds.
“The key to understanding the game,” adds one of Dr. Frink’s colleagues, “is sabermetrics.”
Sabermetrics, adds Frink, was developed by Bill James, whom he shows on his laptop.
Says James: “I made baseball as much fun as doing your taxes.”
“Using Sabermetrics, even an 8-year-old girl can run a ball club with the sagacity of a Stengle and the single-mindedness of a Steinbrenner,” says Frink.
Inspired, 8-year-old Lisa borrows a stack of sabermetrics books and runs off to study up and manage the team.
Meanwhile, Moe wanders by the table to complain about the sabermetricians’ ratio of Seats Occupied to Beers Ordered, or SOBO.
This is an allusion to the very narrowly defined, acronym-prone statistical categories that sabermetricians favor over more traditional gauges of performance, like the fuzzy but impressive runs batted in.
Several examples can be seen in the graphic accompanying “A Coug’s Numbers, A Hollywood Story,” in the winter 2011 Washington State Magazine:
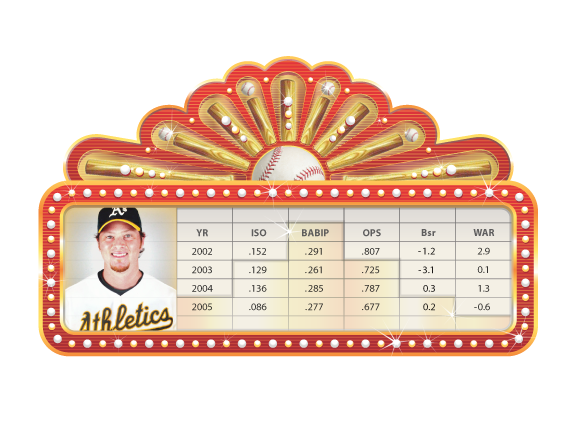
ISO, or Isolate Power, is derived by subtracting a batting average from slugging percentage, leaving a measure of how many extra bases a player averages per bat. It’s a more refined way of looking at a batter’s raw power.
BABIP, or batting average on balls in play, measures how often a batter puts the ball in play and is credited with a hit, excluding home runs.
OPS, or on-base plus slugging, is a combination of on-base percentage and slugging percentage.
Bsr, or Base Runs, estimates the runs a team should score. As predictors go, it’s said to be one of the better sabermetrics categories.
WAR, or Wins Above Replacement, estimates how many more wins a player will give a team compared to a minor league or bench player in the same position. Former Coug Scott Hatteberg’s WAR was 2.9 in the Oakland A’s 2002 season documented in Moneyball and declined after that.
Closely monitored, these and a host of other categories can help a manager make a variety of decisions that will lead to a greater probability of victory. Lisa Simpson sees as much when the Isotots climb in the rankings and earn a championship game against Capital City. But along the way, she is alienated from her brother Bart, whom she orders to not swing after the pitcher walks the two previous batters.
Their conversation gets at one of the many tensions between baseball traditionalists and sabermetricians.
Bart: But I’m on a hot streak!
Lisa: Hot streaks are a statistical illusion!
Spoiler alert, as if you haven’t guessed what happens next.
Bart homers.
After which Lisa says, “That dinger was a fluke.”
Read more about Scott Hatteberg, Moneyball, and sabermetrics in “A Coug’s Numbers, A Hollywood Story.”