For almost half a century, scientists have been measuring carbon dioxide in the air two miles above sea level in the middle of the Pacific Ocean. At first, Charles David Keeling counted 310 parts of carbon dioxide for every million parts of air. When he died in 2005, the number was 380. On May 9, 2013, the number topped 400, “a milepost,” wrote National Geographic’s Robert Kunzig, “on a far more rapid uphill climb toward an uncertain climate future.”
We might get wistful over the elegance of what is now known as the Keeling number: a solitary data point, like the Dow Jones industrial average, the time of day, or your body temperature, conveying a complicated process in the simplest of terms.
Students and scholars analyzing the bottom-most level of the atmosphere, a place called the critical zone, have no such luxury. Measured from the treetops, through soil to the groundwater, the critical zone houses a vast array of interdependent biogeochemical processes. The processes have a huge hand in ecosystem services, like clean water and air, as well as the fate of carbon, global warming’s fundamental element. The critical zone is also a vastly complicated place, what a National Research Council panel called, “the most heterogeneous and complex region of the Earth.”
The bulk of the planet’s life forms reside in the critical zone, but the term didn’t come into its current use until 1998. Scientists have since started taking a systemic approach to get a holistic view of its workings, with the National Science Foundation and others creating dozens of new observatories in watersheds around the United States and elsewhere.
Marc Kramer, an assistant professor of environmental chemistry at Washington State University Vancouver, led five students last fall through the critical zone’s world of complicated relationships. For their lab, Kramer’s students didn’t have to go past the Vancouver campus backyard, a swatch of field and forest just east of the loop road. It is open meadow at its edge, then a mix of deciduous and conifer forest sloping down to a stream.
It offers a good snapshot, says Kramer. To complete their perspective of processes within the watershed, the students would only need to drive just 20 minutes from here into the mountains, where they can also study increasingly common rain-on-snow events.
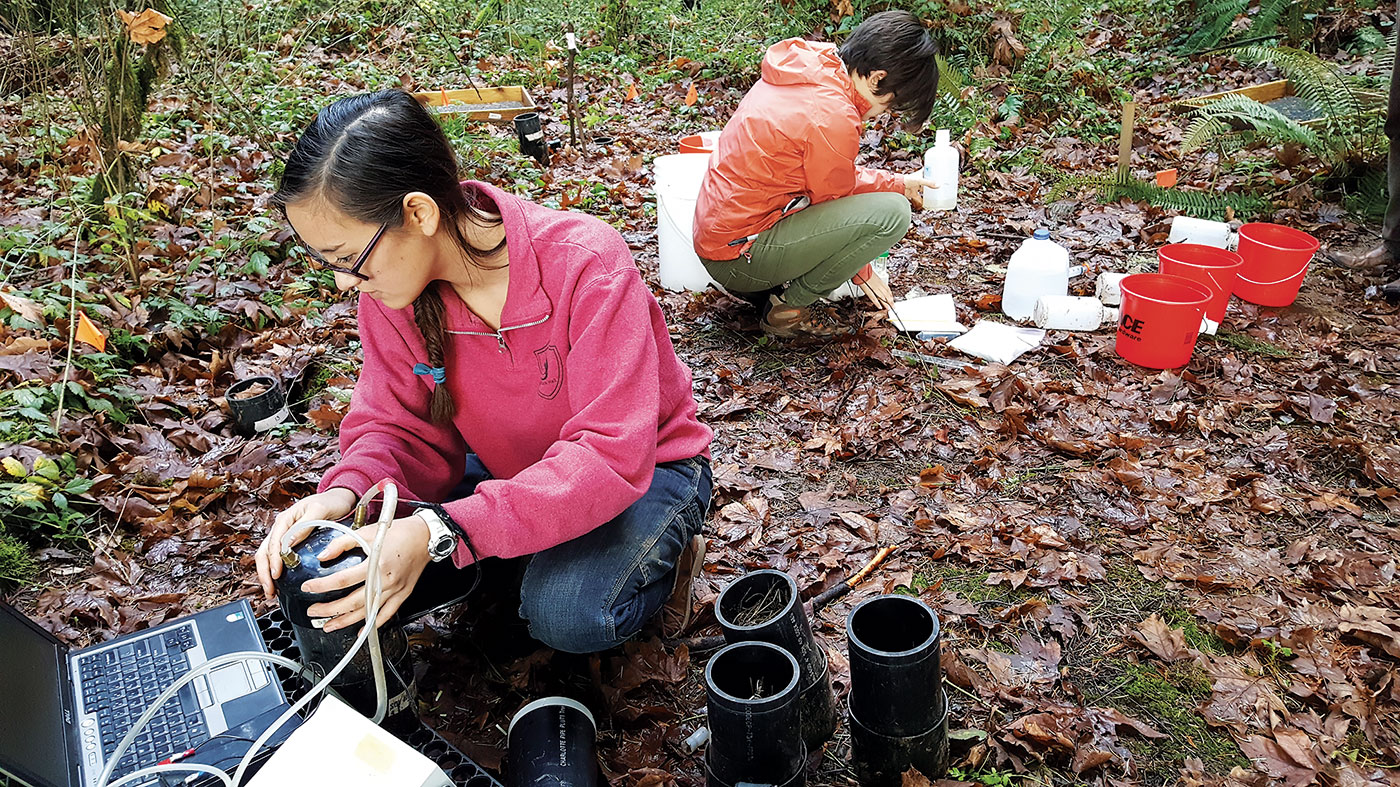
(Photo Eric Sorensen)
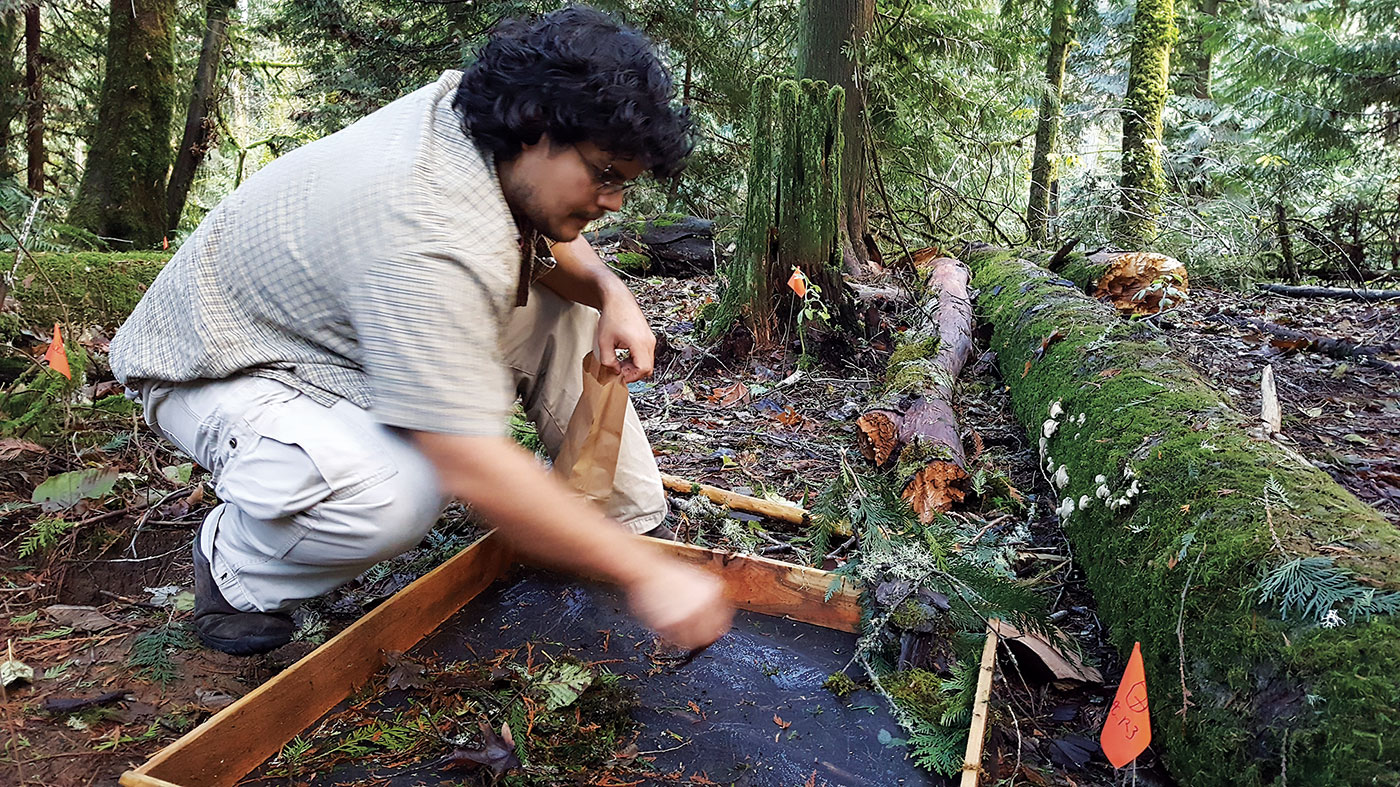
(Photo Eric Sorensen)
It had been a remarkable time to be gathering data, with t-shirt weather in November and the wettest October on record. On their last field day of the semester, the students fanned out to measure a remarkable sweep of things, many involving soil.
“Soils are the quarterback of the critical zone,” says Kramer. “They’re the integral player to what happens.”
In the meadow, Sarah Kintner, a first-year master’s student from Green Bay, Wisconsin, collected water to test for total organic carbon and nitrogen. Their relative amounts in both rain and different soil horizons, including the topmost layer of leaf litter, can give insights into processes going on in each place.
In the woods, Corey Ruder, a doctoral student from near Sacramento, could measure changes in carbon-dioxide concentrations in and around the ground, indicators of root and microbial respiration. The levels tended to be lower in the conifer forest.
Greg Clark, a first-year master’s student from Harrisburg, Pennsylvania, measured precipitation with instruments in the open meadow and under the canopy. Differences between the two can indicate how much precipitation is altered by leaves and branches.
Luke Reyes, a doctoral student from New Jersey, patrolled litter traps, screens that caught leafy matter as it fell from the trees. He would dry the contents, weigh them and do carbon and nitrogen analyses to see how the vegetation is contributing inputs to the soil.
“Around the time the leaves came down there was an increase in carbon concentrations that were dissolving in the top layer of the soil,” he says.
Just then Geoff Kahl, a geology master’s student from Portland, arrives. His boots are wet. He was sampling stream and groundwater to analyze their chemistry.
“Marc,” says Kintner, “look what I’m standing on.”
She’s on a fallen tree that wasn’t there a week ago.
“That’s a large coarse woody debris event right there,” says Kramer, whose Oregon State University advisor, Phil Sollins, pioneered the study of rotting logs and their role in forest ecology.
Reyes has already estimated the standing biomass in a 30-foot radius of the forest. Had the tree fallen in one of his leaf traps, says Kramer, Reyes could dry it, weigh it and estimate its volume.
“That’s a little beyond the scope of an eight-week class,” he acknowledges.
Gathering so many pieces of data and working in a team, the students dramatically increase their capacity to do big science, says Kramer.
“They’re able to tell a more powerful story based on the part they did,” says Kramer.
Back at the science and engineering building, they start trying to figure out what their story might be. They have half a dozen indicators of how water arrives and moves through the system, plus measures of soil moisture, carbon, nitrogen, and carbon dioxide. They have questions about biogeochemical responses to seasonal change, land use, and climate change. They already see big differences between the deciduous and conifer forests, particularly after big winds and four inches of rain came through in mid-October.
Kramer encourages the students to answer the questions they started with but also to look for new questions that might arise from the data they chart. It’s science as a reality-based creative process.
Kramer notes that the western side of the Cascade Mountains in the Pacific Northwest is unique in the age of global warming as it stands to be warmer but also quite wet. The October rain event came from the extratropical air of a remnant typhoon. Between the data of the Intergovernmental Panel on Climate Change, long-term climate data, and projections for the area—from a wealth of numbers both old and new—the students just might have a story to tell.
Indeed, by semester’s end, Kramer reports that, based on the historical record, the students can say the heavy warm rains of October are a proxy and harbinger of things to come.
“I think they’re going to have a high-impact paper,” he says.